Go Beyond Reporting. UNCOVER WHAT YOUR DATA IS TELLING YOU
Tableau’s built-in analytics capabilities make advanced analysis accessible to every user — empowering organisations to identify trends, predict outcomes, and make confident data-driven decisions without needing data science expertise.
Advanced analytics in Tableau are only valuable when they live where analysis actually happens. Tableau’s built-in features — from statistical trend lines to predictive forecasting and data segmentation — work directly within the analytics workflow, with no separate tools or data science expertise required.
BUILT INTO YOUR WORKFLOW
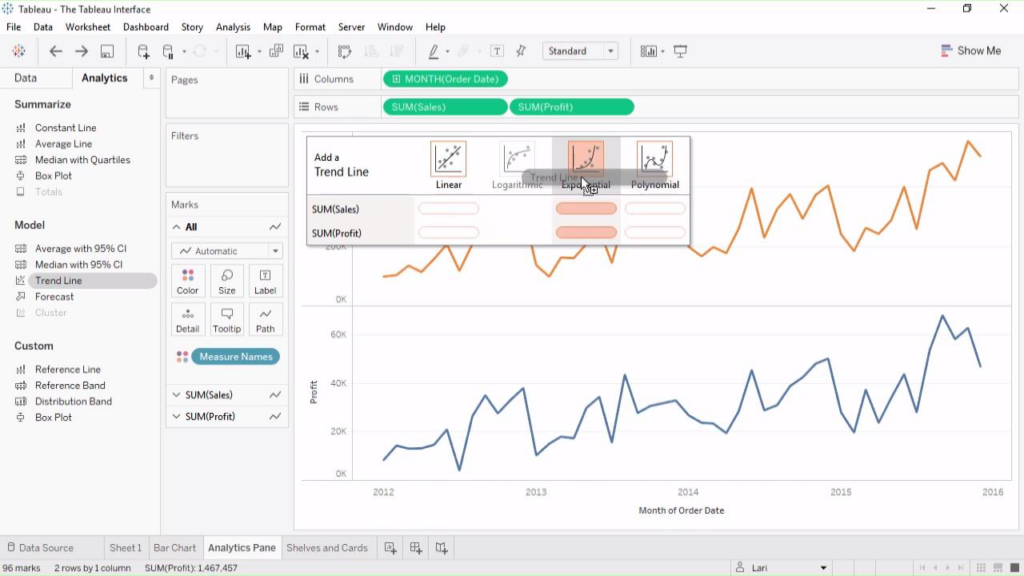
Tableau’s analytics capabilities live directly inside the Analytics Pane — the same place you build every visualisation. There is no separate tool to open, no model to configure, and no data science expertise required. Simply drag an analytic feature onto any chart and Tableau does the rest.
• Accessible directly in the Analytics Pane
• Drag-and-drop to apply — no code required
• Works on any chart type and any dataset
• Results update instantly as your data changes
ADVANCED MODEL INTEGRATION
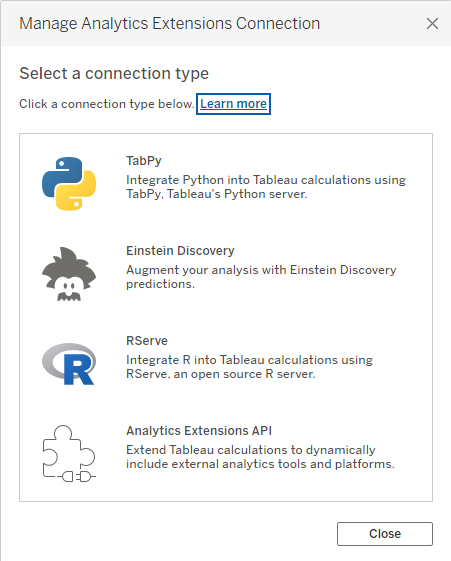
When built-in capabilities are not enough, Tableau’s Analytics Extensions allow you to connect Python or R environments directly to your dashboards. Run custom machine learning models, statistical scripts, and specialised algorithms — and display results as live Tableau visualisations.
• Supports TabPy and Rserve
• Connect Python or R to any Tableau dashboard
• Run custom ML models & return results live
• Configure via Help → Settings & Performance→ Manage Analytics Extensions