Build Dashboards That Don’t Just Inform — They Inspire Action.
Design dynamic, user-friendly dashboards that consolidate multiple visualizations into a cohesive, interactive view built for storytelling and confident decisions.
A great dashboard is more than a collection of charts. It’s a story — one that guides the viewer from context to question to conclusion. Tableau’s dashboard development environment is designed to help analysts and developers build experiences that are visually polished, analytically deep, and intuitively navigable. Whether for an executive summary or an operational monitoring screen, Tableau dashboards deliver the right insight to the right person at the right moment.
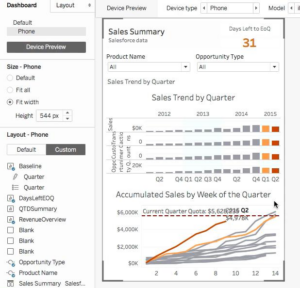
FLEXIBLE LAYOUT CANVAS
Tableau’s canvas gives you full control over layout. Arrange charts, KPI cards, images and text in tiled or floating modes — then fine-tune every element for a polished, on-brand result.
• Tiled and floating layout modes
• KPI cards, charts & text in one view
• Device-specific responsive layouts
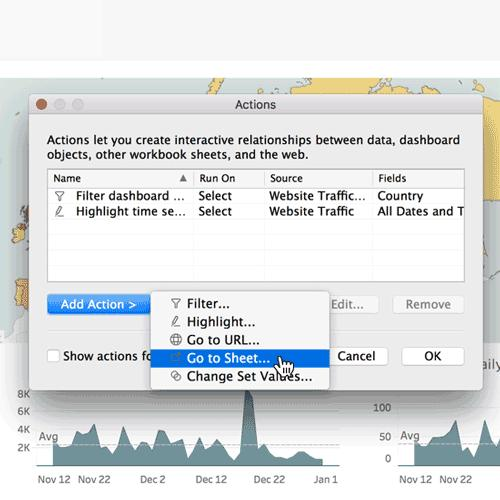
ACTIONS & INTERACTIVITY
Dashboard actions let users filter, highlight, and navigate across sheets by clicking or hovering. Dynamic zone visibility shows or hides sections based on user selections — all configured visually.
• Filter, highlight & URL actions
• Dynamic zone visibility
• Story Points for guided narratives